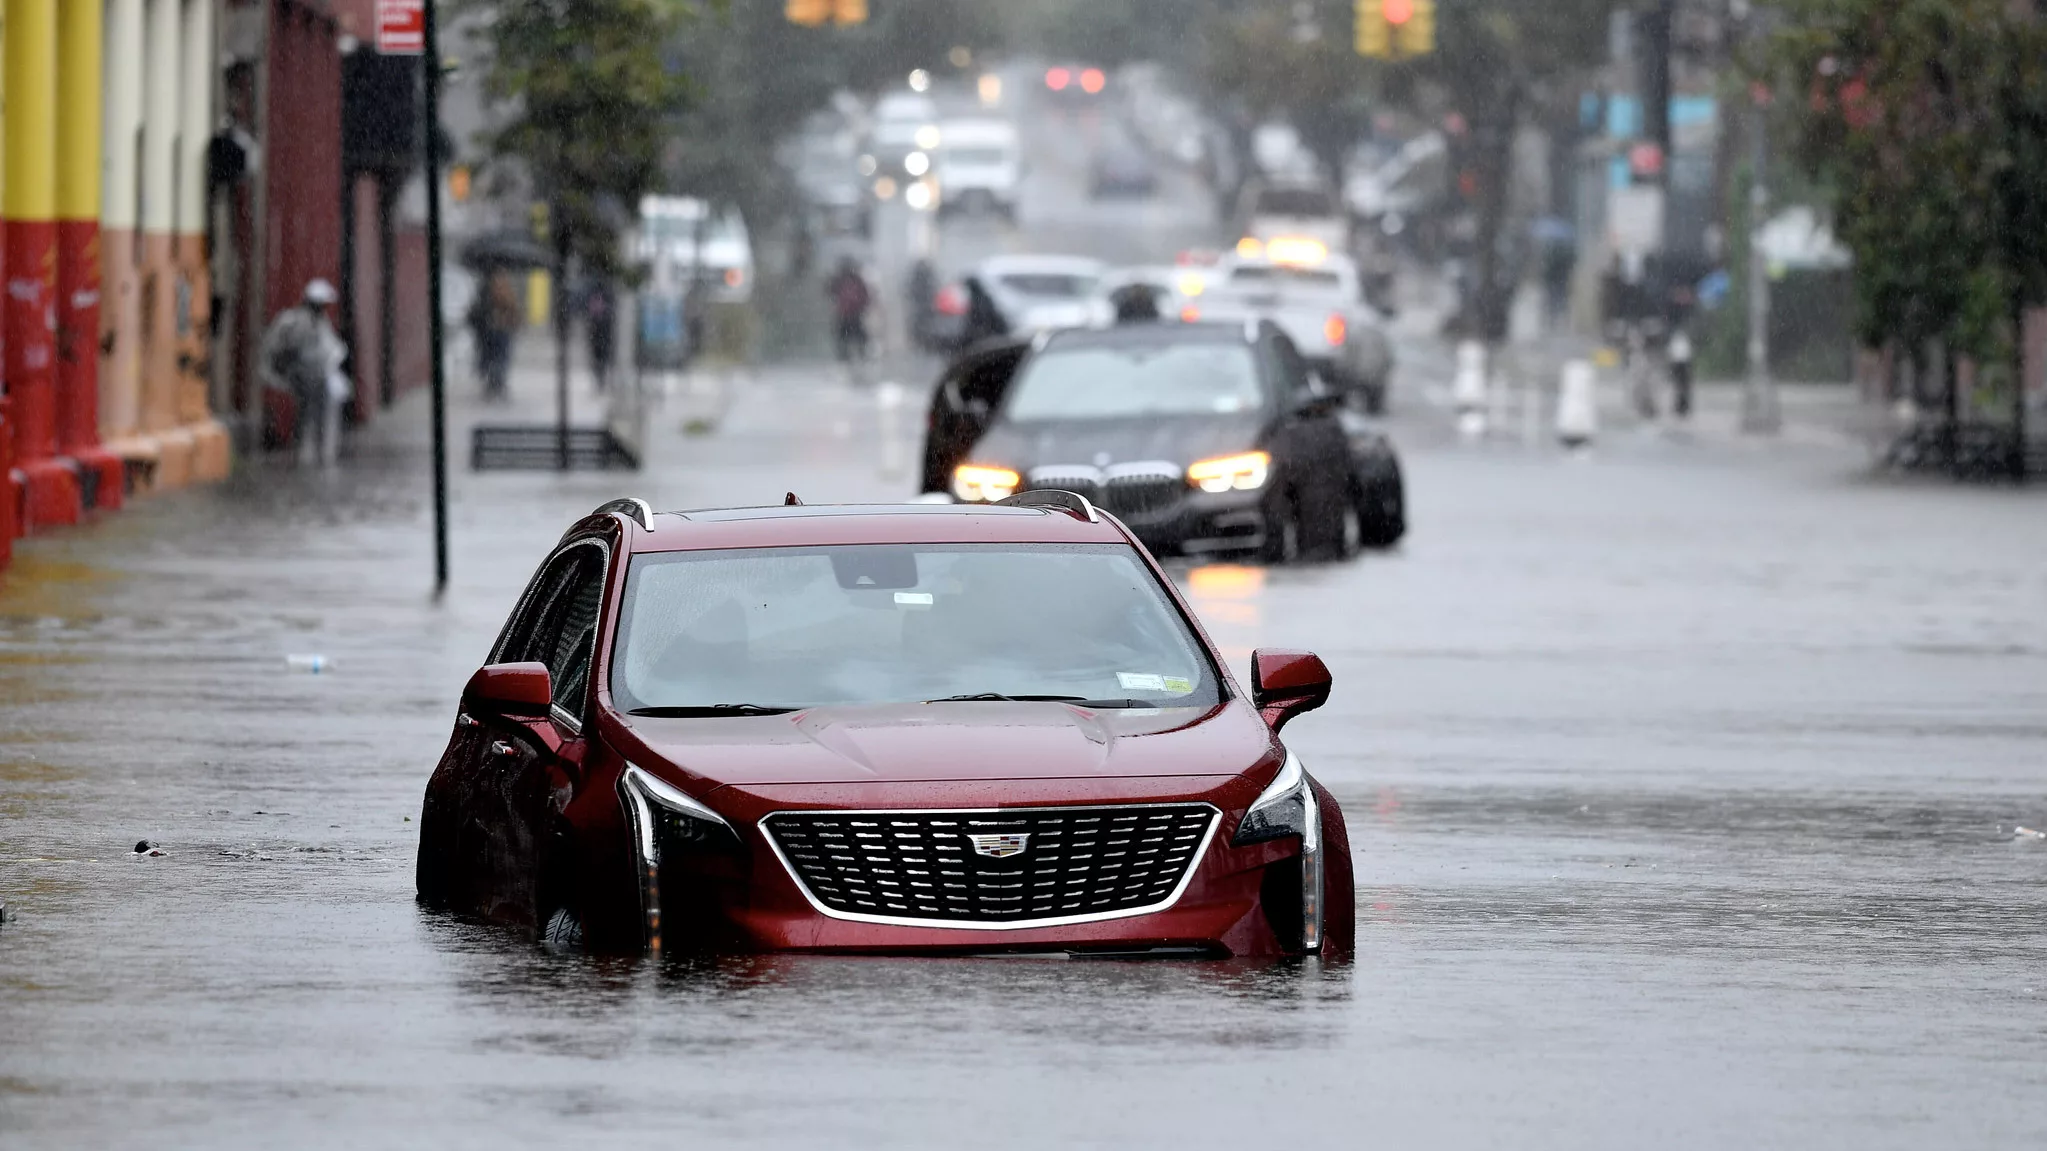
On Sept. 29, New York City was hit with a powerful storm that left many streets and homes flooded, the subway system paralyzed, and the city ground to a halt. Over 1,900 calls were made to the city’s non-emergency line, 311, to report flooding-related conditions, mostly from Brooklyn. An analysis of the calls shows the areas of the city hit hardest have above-average populations of foreign-born residents, according to 311 data cross-referenced with the U.S. Census.
While the city shares data of 311 requests related to street flooding, Documented scanned for all calls related to flooding and the ensuing damage. Documented’s data analysis, totaling 1,907 calls, looked for complaints related to street flooding, clogged catch basins, sewer-related complaints, as well as calls for damaged trees and cave-ins (potholes).
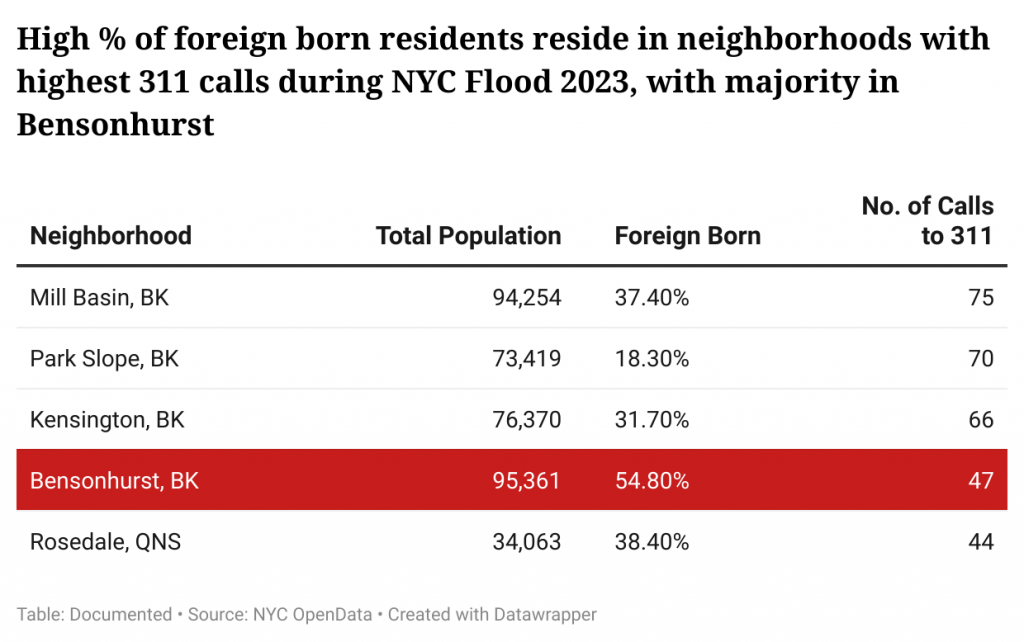
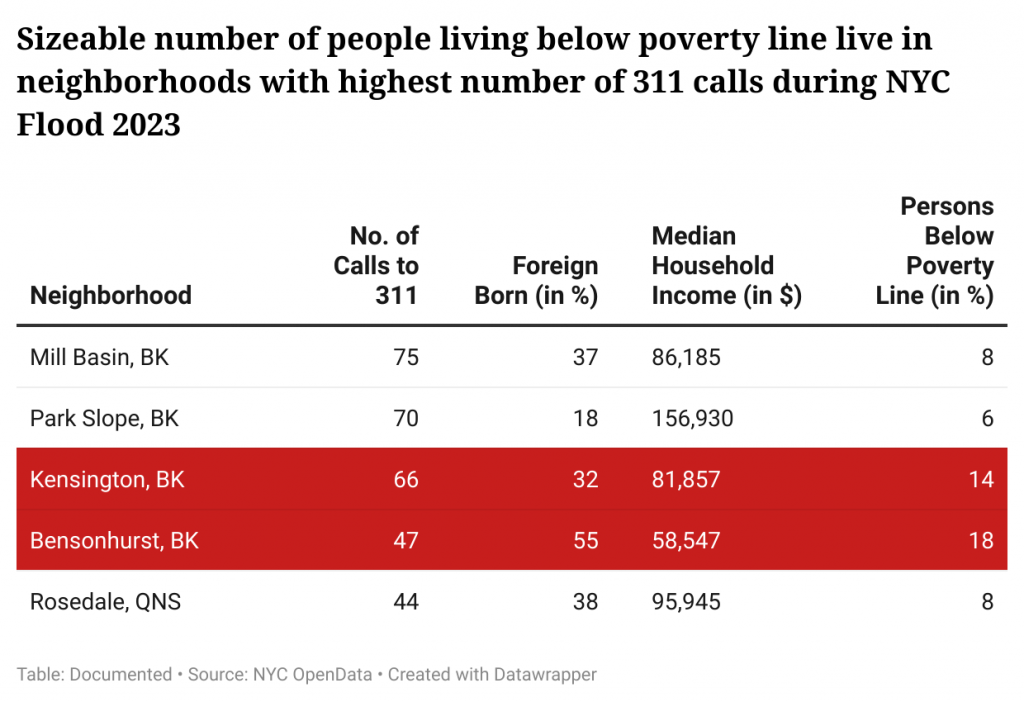
Mill Basin in Brooklyn, zip code 11234, had the most flood-related calls, according to the analysis. Park Slope had the second, followed by Kensington and Bensonhurst. Additionally, most of the top five neighborhoods contained high populations of immigrant residents. Bensonhurst, zip code 11214, had the highest population of immigrant residents at 54.8%, more than double the rate in New York of 22.5%. More than half of its immigrant population comes from Asia.

Read More: Surviving the Water: New York City’s Flooding Crisis in the Age of Climate Change
In April, Documented, in collaboration with Climate Central, published an analysis of over 11 years of 311 data that showed that many of the neighborhoods with the most flooding calls had high populations of immigrants, including Rosedale, Queens, which had 44 calls — the fifth most number of calls from the Sept. 29 storm.
Amy Chester, managing director at Rebuild By Design, a non-profit organization based out of New York that studies how overlapping environmental and human vulnerabilities leave communities at risk, says this last storm was similar to what happened during Hurricane Ida nearly two years ago. In Hurricane Ida, for the first time, the city saw heavy rain in a certain short period of time, and the rain did not fall in equal amounts across the city, she said.
“During Ida, the majority of rain fell in Queens and in neighborhoods which are absolute immigrant neighborhoods,” she explained. “But in this round, the highest rain fell in Brooklyn, specifically Park Slope — that’s an affluent neighborhood.”
In Fall 2022, Rebuild by Design collaborated with Milliman, a global consulting and actuarial firm to study the areas across New York City that could be impacted by coastal flooding in 2050 and to estimate how future coastal flooding in New York City could cause displacement of residents.
The report found that nearly 40% of the city’s population live in high-risk areas. The study divided the percentage of NYC residents into quadrants that calculated flood risk with income level. According to their report, 59% of New Yorkers live in high-income/low flood risk zones; 21% in low-income/low flood risk zones; 15% in high-income/high flood risk areas; and 5% in low-income/high-risk flood zones.

In total, nearly 443,286 people live in crisis zones, with lower-income people living in higher flood-risk areas, which are mostly comprised of people of color living in multi-family rented units. This includes neighborhoods such as Coney Island, the Rockaway Ferry Area, other sections of East Harlem, and parts of Red Hook, where the current median rents are some of the lowest throughout the city due to the concentration of public housing. The median household income of this population is $30,975, with 37 percent of them being “Hispanic or Latino.”
Read More: Climate Change Will Flood NYC Neighborhoods Where Immigrants Live, Data Shows
Chester emphasizes, however, that the report is about storm surge and not rain-induced flooding. But flash flooding as a result of rains is also affecting areas that are in line with the city’s storm surge flooding map. The additional land at Coney Island, for example, was not constructed correctly to withstand flooding. While Coney Island did not make Documented’s analysis top five for 311 complaints, it came in sixth.
Chester adds, “When we look at demographic information for people who live in the floodplain from storm surge, it shows that over 50 percent of people who live in the floodplain of New York City are people of color, and over 50 percent of them are also low income.”
“New York City has seen an uptick in flooding events in recent years due to climate change, which makes storms more intense and harder to manage,” said Elijah Hutchinson, executive director of the Mayor’s Office of Climate & Environmental Justice.
Guy Foster, who oversees United States Geological Survey (USGS) stream gaging networks in New York, said the flash flooding resulted from tropical storm Ophelia’s heavy rainfall that exceeded the local infrastructure’s capacity to drain the water accumulated during heavy rainfall.

Foster said that USGS does not have any way to assess how the boroughs and neighborhoods compared relative to each other in their ability to withstand the flash floods. Although the more consistent flooding is likely because of climate change, inquiries about how NYC is mitigating these events are best answered by the NYC Office of Emergency Management or other City agencies that deal with infrastructure.
October 24, 2023: This story has been updated to include comments from the Mayor’s Office.
Correction: This story has been updated to reflect that Rosedale, Queens, had the fifth most number of calls for the Sept. 29 storm, not the most.